
House prices down 21% – and falling – since the peak
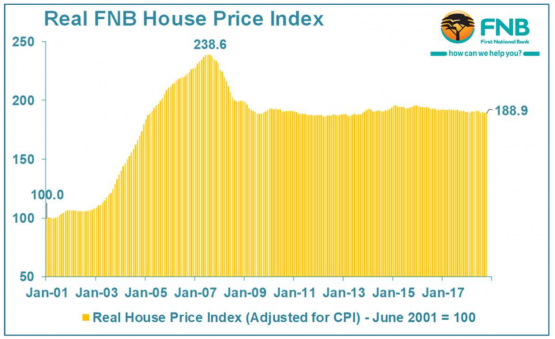
In real terms, including the impact of inflation, house prices have declined by 20.8% since August 2007, the peak of the pre-2008 boom period. This is according to November’s FNB House Price Index, published by John Loos, now property sector strategist at the bank’s commercial property finance division.
In it, he argues that the index remains at “relatively high levels” when considering the longer-run performance (ie. since 2001), but it is obvious that house prices have effectively been flat for the past decade. Loos says the bank doesn’t, however, believe that this cumulative real price correction to date has been sufficient to bring real home values back into line with what are now very weak economic fundamentals.
Source: FNB
The index for 2018 continues to “hover in low single-digit growth territory not too far from 4% year-on-year,” says Loos, adding that the low single-digit growth in nominal terms continues to translate into a year-on-year price decline in ‘real’ terms, when adjusting for CPI inflation. “This means that the gradual housing market price ‘correction’ continues, as it has since early-2016.”
After the impact of inflation, house prices are down roughly 1% year-on-year.
This means house prices continue to decline from that peak in 2007, with the -20.8% figure set to get worse.
Property intelligence outfit Lightstone reports even lower house price inflation, at just 3.5% in its latest report (for October). FNB saw (downwardly) revised growth of 4.1% in October.
While FNB and Lightstone use similar methodologies to calculate their house price indices, the datasets are different. FNB’s is based on “residential properties financed by [the bank] over the past 18 years” while Lightstone uses the broader set of Deeds Office data. Both exclude anomalies and outliers.
Lightstone’s area value band breakdown shows ‘mid-value’ homes far outperforming the rest of the market, with growth of 6.1% year-on-year in October. These are homes priced between R250 000 and R700 000. High-value homes (R700 000 to R1.5 million) are up 3.3%, while low-value homes (under R250 000) are up 2.7% in the month. Luxury homes (over R1.5 million) are barely positive in nominal terms, up 0.5% year-on-year. Add in the impact of inflation (5.1% in October) and the picture looks decidedly more negative.
The performance of these segments squares with FNB’s research, although the bank defines its categories with very different – far higher – average selling prices. These range from R1.05 million to R6.8 million.
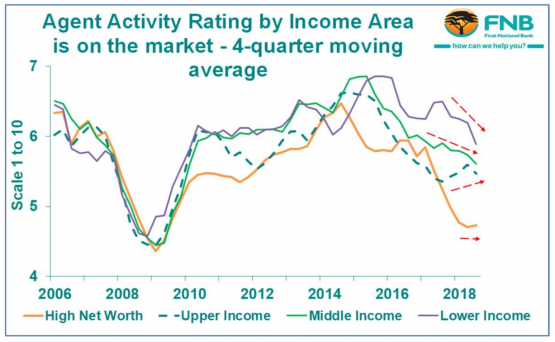
In a separate report, Loos points to the fact that while “in the initial stages of the housing market slowdown, starting around 2014, it was the higher income end of the housing market that appeared to lead the way ‘down’ … more recently, it appears that [these] segments have been showing signs of ‘relative stabilisation’, albeit at already-weak levels”.
The middle and lower income segments have, he says, been weakening more noticeably from their relatively stronger levels. “This can be a sign that financial constraints and pressures amongst households at the lower end are becoming more significant, and this can become a ‘relative drag’ on these segments’ performance.
“Therefore, a key theme in 2019 may be a ‘convergence’ in performance of the various income/price segments of the housing market, the lower-to-middle end’s relative ‘outperformance’ fizzling out.”
Source: FNB
Loos says it appears likely that the average house price growth rate for 2018 will be slower than that of 2017, making this the fourth consecutive year of average price growth slowdown. He highlights the fact that “FNB’s valuers” continue to point to housing demand weakening.
To November, the average house price growth rate is 3.7%, compared to the 4.3% of 2017. He points out this is noticeably slower than the 6.8% high reached in 2013.
While the bank’s economists forecast GDP growth of 1.4% in 2019, versus the 0.7% for this year, it says that projected higher interest rates will “offset the mild support for the housing market” coming from slightly stronger economic growth.
The bank sees a further interest rate hike next year after the one in November 2018.
In 2019, FNB projects “nominal average house price growth to be 3.7% for next year” (in other words, very similar to the 2018 likely outcome). Given the bank’s economics unit forecast of CPI of 5.3% for 2019, “this would translate into another year of house price decline in real terms”.
A 1.6% decline, to be exact.
Hilton Tarrant works at YFM. He can still be contacted at [email protected].
Source: moneyweb.co.za


